
Operator Hypotheses #1: Research Grid
Started: October 2025 (Month 11 post-seed) | Check back: October 2026

About This Series
Operator Hypotheses tests whether SaaS execution patterns can be forecast from public signals. Each entry tracks one company for up to 12 months to see if repeatable forks appear at predictable windows (e.g., Month 9–18).
The goal: Can public-signal analysis (hiring data, press releases, funding disclosures) reliably forecast execution traps 6–12 months ahead? I’m not predicting outcomes—I’m testing whether specific execution patterns are forecastable based purely on company stage and type.
See Pattern #0 (Start Here) for the framework.
Pattern #1: The services trap - custom integration requests that turn software companies into consulting firms.
Why I’m Watching: Research Grid
Research Grid sits at a bottleneck AI recently created. When AI breaks one bottleneck, value flows to whoever fixes the next constraint. Foundation models (GPT-4, Gemini, Claude) broke the first wave—but those models created a new problem: the data quality bottleneck needed to train next-generation models.
AI accelerated target discovery: Xaira’s $1B raise signals the shift.1 The bottleneck moved to clinical trials. Discovery now takes months, but trials still take 6–8 years and cost $400M annually per Phase 3 trial in administrative and operational overhead.2
Research Grid automates trial operations: site feasibility went from 6 months to minutes3, 98% efficiency improvements reported4, 20x revenue growth.5 They’re positioned at the right constraint.
But there’s a complication: Clinical trials are notoriously difficult to productize.8 Patient recruitment faces systemic challenges (misinformation, mistrust, doctor incentives, narrow inclusion criteria), and pharma customers are known for wanting bespoke solutions. This makes Research Grid more vulnerable to the services trap, not less.
I want to test whether execution determines if they capture value despite these headwinds. Specifically: whether they fall into the services trap that kills most B2B SaaS exits.
The Fork in the Road
Imagine you’re 11 months post-seed. Revenue grew 20x. A top-tier pharma customer calls—they love the product and want to expand from $150K to $400K annually. There’s one thing: they need a custom connector to their legacy trial management system. “Maybe 4–6 weeks of work? We’ve budgeted for it.”
This moment is actually a test. Say yes: that 6-week project takes 4 months. Two more customers see you did custom work and ask for their own integrations. By Month 14, you have 3–4 engineers maintaining custom branches instead of building the platform. Gross margins compress. Product roadmap slips. By Month 20, you’re no longer a software company—you’re a consulting firm with a software wrapper.
The revenue that looked like success was the beginning of failure. Configuration scales (build once, all customers benefit). Customization doesn’t (build for one customer, maintain it forever, economics break). The difference between saying yes and saying no determines whether you exit at $300M or build toward $3B.
That decision point—where growth and fragility look identical—is exactly what I’m tracking at Research Grid.
The Pattern I’m Watching For
Timing: Between Month 9–18 after seed, enterprise B2B SaaS companies get asked to build custom integrations for major customers.
The request:
Major customer loves the product but needs it to “feed into our existing workflow”
Asks for custom connector to legacy systems
Willing to pay ($200–400K/year)
Sales pushes hard
Most founders say yes.
What happens:
Custom work takes 4x longer than estimated (4 months vs 6 weeks)
More customers ask for custom work (they saw it happen)
Engineers maintain custom branches instead of building platform
Professional services run at 20–35% gross margins vs 75–85% for software6
As blended margins drift into the low-60s, reclassification risk rises from ‘software’ → ‘services’
Valuation multiples drop 50%+
Pattern Reference (The Services Trap)
The trap: Custom integration requests between Month 9–18 that turn software companies into consulting firm
The fork: Configuration (builds once, scales to all customers) vs Customization (builds for one customer, doesn’t scale)
How to recognize it:
• Gross margins declining quarter-over-quarter
• 20% of engineering time on customer-specific work
• Services revenue >20% and growing faster than software revenue
• Product roadmap constantly slipping due to customer commitments
The decision: “We’ll build configuration tools that let you connect to any system, but we won’t maintain custom code for individual customers.”Why it matters: Services compress margins → investor reclassification risk (common around blended margins drifting into the low-60s) → multiple compression (order-of-magnitude: ~50% drop) → capped exit ($300–500M vs $3B+)
Examples from public data:
Snowflake: Kept services <6%, ran them at -34% margin (deliberately unprofitable to discourage growth)
UiPath: Kept services <5%, also ran at negative margins (deliberately)
Veeva: Started near 50% services; brought it down to ~20% pre-IPO
Apttus: CPQ software requiring heavy implementation, raised $404M, targeted IPO, sold to PE instead
My hypothesis: This trap appears predictably at Month 9-18. Even well-positioned companies fumble here.
The Hidden Constraint: Who Owns the Trial Intelligence?
It’s tempting to treat the services trap as the main event. In reality, it’s a symptom. Two earlier forks—data/learning ownership and channel strategy—determine whether the services trap is even escapable.
Data ownership decisions are contractual and sticky—made early, hard to reverse. These terms are typically embedded in first-wave contracts. Once signed, they’re hard to renegotiate, which is why they govern everything that follows. That’s why they determine whether the later forks are choices or constraints.
Clinical trials generate incredibly valuable data: Which sites perform best for which conditions? Which patient populations recruit fastest? Which investigators are most reliable? How long do different trial types actually take?
There are two structural paths:
Path A: Customer-Exclusive Trial Intelligence
Each sponsor (pharma company or Contract Research Organization [CRO]) owns its trial data exclusively
Research Grid can’t reuse or train across trials
Every trial is greenfield engagement
No compounding, no network effects
Result: Workflow vendor with linear revenue
Path B: Shared Learning / Aggregated Intelligence
Customer data stays private and never leaves their boundary
But Research Grid’s algorithms improve from operational patterns across all trials
“We’ve optimized 1000+ trials; your trial benefits from that collective intelligence”
Network effects: Platform gets smarter with scale
Result: Intelligence layer, not just workflow automation
If trial learnings are customer-exclusive, the services trap isn’t a choice—it’s a constraint.
If each pharma client’s data can’t feed a global model, every deployment must be bespoke. You can’t build configuration tools that work across all trials because you don’t have cross-trial intelligence. You can’t resist customization because you have no platform value to point to.
Observable Signals:
Path B indicators would include:
Marketing mentions of “benchmarking across trials” or “system-wide improvements”
Privacy/architecture documentation describing federated or aggregate learning (even if data never leaves sponsors)
Customer testimonials praising “continuously improving accuracy” beyond their own data
Engineering blog posts about “privacy-preserving cross-trial learning”
Path A indicators:
All language emphasizes “your data stays with you” with no mention of collective intelligence
Compliance messaging only (GxP-ready, HIPAA, 21 CFR Part 11) with no learning layer
Each customer described as separate implementation
Current Evidence: Compliance emphasis in public materials suggests Path A. No public mention of aggregated analytics or cross-trial learning.
Evidence quality: low–medium (public materials limited; absence ≠ disproof).
The Channel Fork: CRO-Dependent vs Multi-Channel
Research Grid is going to market through CRO partnerships. This is a classic channel conflict setup: Partners provide early distribution and validation, then you want to go direct to bigger customers, and partners retaliate.
Critical distinction: Channel = who owns the relationship; Services = how you deliver. They correlate but aren’t the same.
The Fork:
Path A: CRO-Dependent (Single Channel)
All sales through CRO partnerships
CROs control pharma relationships
Research Grid is “vendor to CROs,” not known by pharma companies
CROs can switch to competitors or build in-house
TAM capped at ~100 CROs
Pricing power limited (vendor, not strategic partner)
Path B: Multi-Channel GTM
CRO partnerships PLUS direct pharma sales
Research Grid owns pharma relationships directly
CROs become one channel of many (non-exclusive)
Must renegotiate CRO contracts carefully
TAM expands to 1000+ pharma companies
Strategic value increases (infrastructure layer)
Path C: Pivot Fully Direct
Abandon CRO channel entirely
Go direct to pharma only
Risk: Burn bridges with CROs who provided early validation
Why This Fork Matters:
Different outcomes (illustrative order-of-magnitude):
Path A → Single-digit revenue multiples with capped TAM, strategic exit to CRO or consulting integrator
Path B → Mid-teens revenue multiples with platform margins (>70%), path to infrastructure-scale exit
Historical examples:
Veeva went direct to pharma (Path B success)
Many companies tried multi-channel and lost both (channel conflict paralysis)
Timing: This fork hits Month 12–20, the same window as services trap.
Critical interaction: Who makes the customization request signals which path you’re on.
If CRO requests customization on behalf of pharma → You’re still CRO-dependent
If pharma requests customization directly → They know you exist, multi-channel emerging
Observable Signals:
Path B indicators:
First unambiguous direct-pharma logo (not co-branded with a CRO) by Month 18 or earlier = multi-channel confirmed
Sales hire with “pharma regulatory/compliance” background (not “CRO relationships”) by Month 18 or earlier
“Non-exclusive partnership with [CRO name]” language in press releases by Month 20
Product positioning shifts to “used by pharma companies” not “powering CROs”
Path A indicators:
CRO exclusivity language in new PR or job posting = staying dependent
All case studies feature CRO brands only
Sales hires with “CRO channel” or “partner management” backgrounds
“Expanding partnership with [CRO]” announcements with no direct pharma mentions
Falsifiers:
If CRO-exclusive deals persist yet they disclose >70% margins and rapid feature cadence, that falsifies ‘CRO dependency caps margin/scale’.
Current Evidence: All announced partnerships are CRO-focused. No direct pharma relationships mentioned. No enterprise sales hires with pharma background.
Evidence quality: low–medium (public materials limited; absence ≠ disproof).
The Business Model Fork: Platform vs Full-Stack CRO
The Fork:
Path A: Platform (Software Layer)
Software enabling CROs and pharma to run trials more efficiently
SaaS margins (70–85% gross margins)
Scalable, but slower revenue recognition
Valuation as software company
Path B: Full-Stack (Tech-Enabled CRO)
Become a CRO that runs trials themselves using proprietary tech
“Research Grid Trials” or “turnkey trial operations”
Faster revenue growth through trial contracts
But: Re-enters services trap permanently (headcount-bound)
Margins compress to traditional CRO levels (20–35%)
Valuation as services business
Why This Fork Matters:
Not just product scope (point solution vs platform), but fundamental business model (SaaS vs services).
Note on terminology: “Business Model: Platform vs Full-Stack CRO” (this fork, about SaaS vs services business) is distinct from “Product Scope: Point Solution vs Platform” (about feature breadth).
If Path B (Full-Stack CRO): The services trap becomes permanent by design, not accident. Capital-intensive, margin compression, headcount-bound scaling.
Observable Signals:
Path B would be signaled by:
Marketing language: “We run trials for you” not “You run trials better with us”
Hiring: Clinical research coordinators, site relationship managers
Revenue model: Per-trial contracts, not platform licenses
Falsifiers:
If they announce “we run trials” + hire clinical operations headcount (not just engineers), that falsifies a pure platform trajectory
If they maintain software-layer positioning, engineering-heavy hiring, and license pricing while disclosing sustained >70% margins, that falsifies a drift toward full-stack services
Path A signals:
“Software layer” positioning maintained
Engineering-heavy team composition
Platform pricing (licenses, seats, usage-based)
Current Evidence: Early design partners reportedly mid-size CROs → Path A leaning. No signs of operating as CRO themselves.
Evidence quality: low–medium (public materials limited; absence ≠ disproof).
How These Forks Interact
Early contracts (Month 3–12) determine late outcomes (Month 20–36).
Everything else is downstream engineering and GTM math.
Predictions assume Fork #1 (Data Ownership) locks the degrees of freedom for Fork #2 (Channel), which in turn sets the slope of Fork #3 (Services). These forks are not independent. Early choices constrain later ones. The cascade looks like this:
Early forks determine whether later ones are choices or constraints.
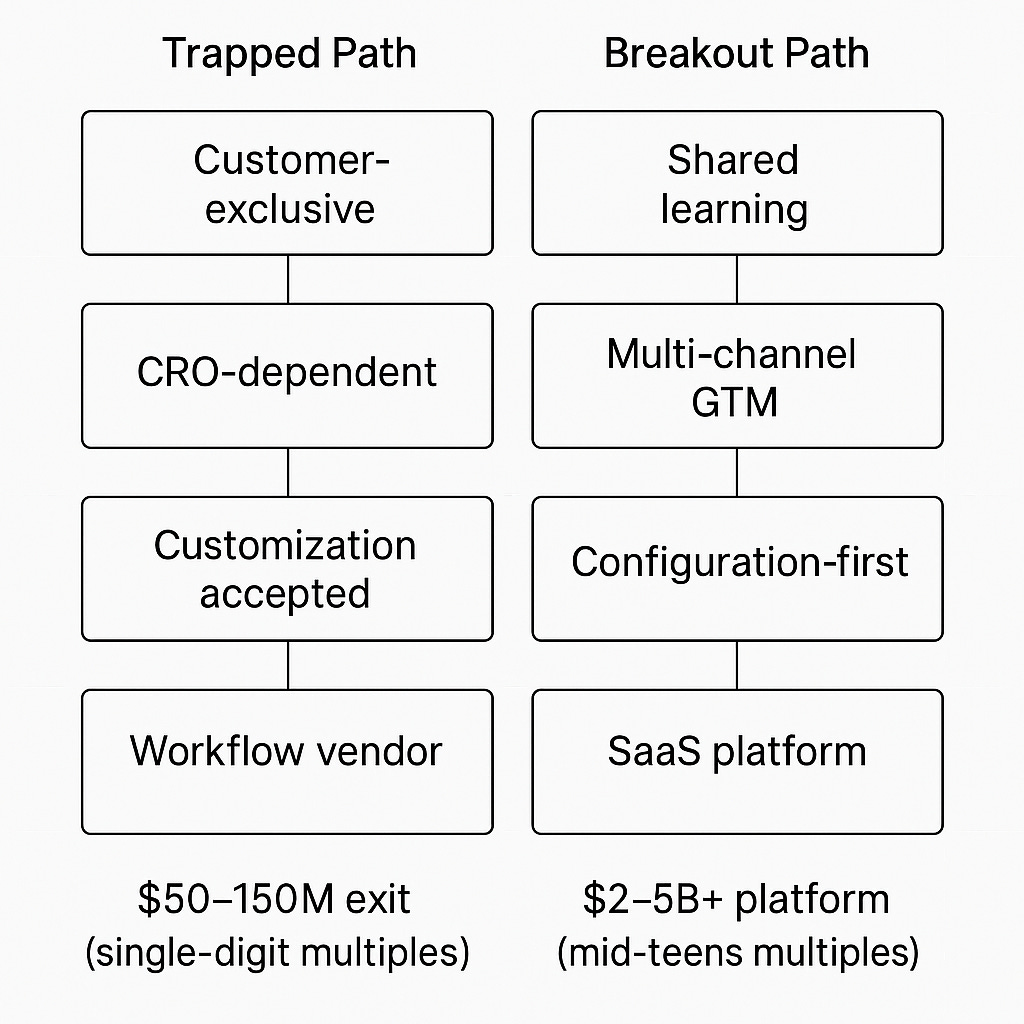
Scenario A: Trapped Path
Fork #1 (Data) → Path A: Customer-exclusive trial intelligence
Constrains → Fork #2 (Channel): Hard to justify direct pharma sales (no platform intelligence to offer)
Constrains → Fork #3 (Services): Can’t resist customization (no cross-trial learnings = no configuration tools)
Constrains → Fork #4 (Business Model): Stuck as workflow vendor
Result: CRO-dependent vendor doing custom work → Illustrative exit: Single-digit revenue multiples, $50–150M strategic sale to CRO or consulting integrator
Scenario B: Breakout Path
Fork #1 (Data) → Path B: Shared learning model
Enables → Fork #2 (Channel): Can sell direct to pharma (platform intelligence = clear value)
Enables → Fork #3 (Services): Can say “no” to customization (configuration works because of intelligence layer)
Enables → Fork #4 (Business Model): Platform play with strong margins
Result: Multi-channel infrastructure platform → Illustrative exit: Mid-teens revenue multiples with >70% margins, $2–5B+ strategic or IPO
The Root Cause:
Data ownership (Fork #1) is causal. If locked into Path A (customer-exclusive) at Month 3–12, the other forks become much harder to navigate successfully, even with perfect execution.
The services trap (Fork #3) is symptomatic. It describes how the problem manifests, but data ownership explains why it persists.
My Predictions for Research Grid
Predictions assume Fork #1 (Data Ownership) locks the degrees of freedom for Fork #2 (Channel), which in turn sets the slope of Fork #3 (Services). These predictions now account for multiple interacting forks, not just the services trap in isolation.
Base Prediction: The Request Arrives Around Early 2026
By roughly Month 15–16 (January-February 2026), a major pharma customer asks Research Grid to build a custom integration with their internal compliance or trial management system.
The request will sound like: “We love the product, but need it to feed into our existing workflow. Build this connector and we’ll extend the contract.”
Revenue will be real: $200–400K/year.
Critical signal: Who makes the request?
If made through CRO partner → Still CRO-dependent (Fork #2: Path A)
If made by pharma directly → Multi-channel emerging (Fork #2: Path B)
Execution Path A (if they say YES to customization + fall into trap)
Month 16–18:
Services revenue grows to >20% of total
Gross margins compress below 70%
3–4 engineers spending 60%+ time on custom branches
Product roadmap slips 6+ months
All growth still through CRO channel (no direct pharma logos)
No mention of cross-trial learning or benchmarking
Month 18–20:
CRO partnerships show strain (pharma calls direct, CROs partner with incumbents)
Engineering turnover increases
Forced to build enterprise sales from scratch
Still no shared learning signals
Month 20–24:
Series A at 6–10x ARR (below SaaS market rate) OR strategic acquisition conversations begin
Margins tell the story: blended margins drifting into low-60s = reclassification risk
Lead investor likely services-focused or strategic (CRO, consulting integrator)
Outcome: Strategic exit to Accenture/CRO/similar around $300–500M in 3–4 years (illustrative order-of-magnitude)
This is compound failure: Customer-exclusive data (Fork #1) + CRO-dependent (Fork #2) + Customization accepted (Fork #3) = Fully trapped
Execution Path B (if they say NO to customization + escape trap)
Month 15–18:
Build configuration tools instead of custom integrations
Services stay <20% of revenue; gross margins sustain >70%
Product velocity maintained
Hire enterprise sales rep (pharma regulatory/compliance background) to ramp over ~6 months
First direct pharma logo announced (not co-branded with CRO) by Month 18 or earlier
Evidence of potential shared learning (though likely too late if contracts are exclusive)
Month 18–20:
2–3 customers acquired direct (not just CRO channel)
CRO contracts restructured to non-exclusive by Month 20
Multiple GTM channels working
Platform positioning strengthened
Month 20–24:
Series A at 12–18x ARR with strong margin story (>70%)
Lead investor infrastructure/growth-focused
Outcome: Path toward $2–3B+ exit in 5–7 years (illustrative order-of-magnitude)
This requires success across multiple forks: Shared learning (Fork #1, if negotiated early) + Multi-channel (Fork #2) + Configuration not customization (Fork #3) = Breakout
What Would Falsify This
Timing failures:
Customization requests arrive at Month 10–12 or Month 20+ → my timing window is wrong
Requests never arrive → enterprise SaaS doesn’t work the way I think it does
Mechanism failures:
Requests arrive, they say yes, margins compress, but Series A still comes at 15x+ ARR → investors don’t care about margins the way I think they do
Requests arrive, they say yes, but margins stay >70% → services economics don’t compress margins the way public data suggests
Fork interaction failures:
Data ownership fork never mattered → Evidence that customer-exclusive models can still build platform business
Channel conflict didn’t constrain → Successful multi-channel despite CRO exclusivity
Universal falsifier: If they demonstrate platform margins (>70%) and sustained release cadence while remaining CRO-exclusive, our causal claim (Channel limits margin/scale) is wrong
Selection failures:
Requests arrive, they say no (build configuration not customization), but they still fail/exit at low multiple → being at right bottleneck + good execution isn’t enough
Different failure mode entirely (product doesn’t work, market doesn’t materialize) → I’m watching the wrong variable
Pattern universality failures:
Healthcare/pharma SaaS might actually require customization for compliance → pattern doesn’t apply here
Research Grid might have already solved this (configuration tools already exist) → I’m late to spot the fork
Data limitations: Beyond Veeva, I lack biotech/pharma-specific SaaS examples with disclosed services revenue percentages. Most clinical trials software companies are either: (a) acquired early before margins are disclosed, (b) privately held with no public data, or (c) hybrid software+services models from inception. This is a limitation—having 1 healthcare example vs 3 general SaaS examples makes pattern confidence lower for this specific vertical.
What I’ll Watch For (Public Signals)
All indicators are inferable from hiring data, press releases and funding disclosures—no insider info.
By roughly Month 15–16 (early 2026):
Customization Request
Path A: “Strategic partnership” announcement that might signal custom work, request comes through CRO partner
Path B: Direct pharma engagement, request comes from pharma company directly (Check Jan–Feb 2026)
Data Ownership
Path A: Compliance-only messaging (GxP-ready, HIPAA), each customer as separate implementation
Path B: Marketing mentions “cross-trial benchmarking” or “system-wide improvements,” federated learning language (Check Jan–Feb 2026)
Channel Strategy
Path A: All partnerships remain CRO-focused, “expanding partnership with [CRO]” announcements
Path B: First unambiguous direct-pharma logo (not co-branded with CRO) by Month 18 or earlier (Check Jan–Feb 2026)
By Month 18 (April 2026):
Product Velocity
Path A: Product release cadence slowdown, roadmap slips
Path B: Sustained quarterly releases, maintained velocity (Check April 2026)
Hiring Pattern
Path A: More engineering roles with “customer deployment” or “implementation” focus, “CRO channel” sales roles
Path B: Enterprise sales hire announced with pharma regulatory/compliance background by Month 18 or earlier (Check April 2026)
Engineering Resource Allocation
Path A: Engineering headcount growing faster than customer count (services trap signal)
Path B: Customer count growing faster than engineering headcount (Check April 2026)
By Month 20–24 (Series A timing, mid-to-late 2026):
The Decisive Signals
Margin Story
Path A: Gross margins drifting into low-60s or declining trend, services revenue >20% and growing (Check Jun–Oct 2026)
Path B: Gross margins sustained >70% for multiple quarters, services staying <20% of total (Check Jun–Oct 2026)
Customer Count & Channel
Path A: <20 disclosed customers, all growth through CRO channel only, no direct sales capability built (Check Jun–Oct 2026)
Path B: >30 disclosed customers, 3+ customers acquired through direct sales (not just CRO channel), enterprise sales hire ramped and productive (Check Jun–Oct 2026)
Series A Terms
Path A: Series A at 6–10x ARR or strategic acquisition conversations, lead investor services-focused (Check Jun–Oct 2026)
Path B: Series A at 12–18x ARR with strong margin story, lead investor infrastructure/growth-focused, CRO contracts restructured to non-exclusive by Month 20 (Check Jun–Oct 2026)
How to Follow Along
This is a 12-month experiment testing whether public-signal analysis can forecast execution traps before they happen.
Watch for these checkpoints:
Early 2026 (Month 15–16): The customization request arrives (or doesn’t). Look for “strategic partnership” announcements or unusual engineering hiring spikes. Who makes the request—CRO or pharma directly—signals channel strategy.
April 2026 (Month 18): Path divergence becomes visible. Path B companies will announce enterprise sales hires with pharma backgrounds and first direct pharma logos by Month 18 or earlier. Path A companies will show product release slowdowns and all growth through CRO channel.
Mid-to-Late 2026 (Month 20–24): Series A announcement tells the complete story. Valuation multiple + margin disclosure (if shared) + lead investor type reveal which path they took across all forks.
The core question this tests: Can you reliably predict services traps 6–12 months ahead from company stage and type alone? And more fundamentally: Can you identify the hidden forks (data ownership, channel strategy) that determine whether the visible fork (services trap) is escapable?
For Research Grid specifically: Does great positioning (downstream AI beneficiary) + weak execution across multiple forks (customer-exclusive data + CRO-dependent + services trap) = missed opportunity?
Check back October 2026 to see which path Research Grid took—and whether this pattern holds predictive power.
References
[1] Conger, K. (2024). “Xaira, an AI drug discovery startup, launches with a massive $1B.” TechCrunch. https://techcrunch.com/2024/04/24/xaira-an-ai-drug-discovery-startup-launches-with-a-massive-1b-says-its-ready-to-start-developing-drugs/
[2] Research Grid. (2024). “Research Grid raises $6.5 million to make clinical trials admin-free.” PR Newswire. https://www.prnewswire.com/news-releases/research-grid-raises-6-5-million-to-make-clinical-trials-admin-free-302297019.html
[3] Research Grid. (2025). “Clinical Trial Site Feasibility: from 6 Months to Minutes with Research Grid’s New Automation Tool.” PR Newswire. https://www.prnewswire.com/news-releases/clinical-trial-site-feasibility-from-6-months-to-minutes-with-research-grids-new-automation-tool-302523485.html
[4] Melas, N. (2024). “Research Grid Raised $6.48M to Drive Automation in Clinical Trials.” BioPharmaTrend. https://www.biopharmatrend.com/news/research-grid-raised-648m-to-drive-automation-in-clinical-trials-1013/
[5] Conger, K. (2024). “Research Grid raises $6.4 million to automate clinical trial admin.” TechCrunch. https://techcrunch.com/2024/11/05/research-grid-raises-6-4-million-to-automate-clincal-trial-admin/
[6] Benchmarkit. (2024). “2024 SaaS Performance Metrics.” https://www.benchmarkit.ai/2024benchmarks
[7] Stay SaaSy. (2022). “How to Improve Your Gross Margins.” https://staysaasy.com/product/2022/06/12/how-to-improve-your-gross-margins.html
[8] Krishnan, N. (2020). “Healthcare Ideas That Look Good But Are Bad - Clinical Trial Matching.”
https://www.outofpocket.health/p/healthcare-ideas-that-look-good-but-are-bad
Personal tracking document. Pattern #1: Services trap in B2B SaaS (Month 9-18). Analysis based on 4 public S-1 filings and benchmark data. Predictions will be evaluated October 2026.
Meta Pattern Tracking:
Pattern #1: Services trap (timing: Month 9-18)
Currently tracking: Research Grid (clinical trials automation)
Next candidate:
This is a lovely deep dive in the way you think about markets and signals. I’ve lived through the service requests at a SaaS and we were stuck at that bottleneck where founders didn’t want to build until customer paid for a feature. In your opinion, what comes first? How should this be prioritised? Especially in bootstrapped ventures where the model is not “pump money” but build sustainably so we don’t go bankrupt